Exploring Azure Monthly Expenditure Analysis Using Power BI
Managing cloud costs, a crucial part of FinOps, can be quite challenging. Azure, as a public cloud platform, hosts a variety of workloads in different service categories and regions, making cost management a complex task.
In this article, I will show you how I created a Power BI dashboard to dig deep and analyze the expenses related to my Azure usage.
There are multiple ways to track usage and associated costs. While using the Azure cost management API is one option, for the purpose of this article, I will demonstrate how to utilize the monthly usage file, which offers a more user-friendly solution.
To get started, you should go to your subscription and access the invoices section.
From there, navigate to the ‘More Options’ section and download the monthly usage file in CSV format for a specific billing period.

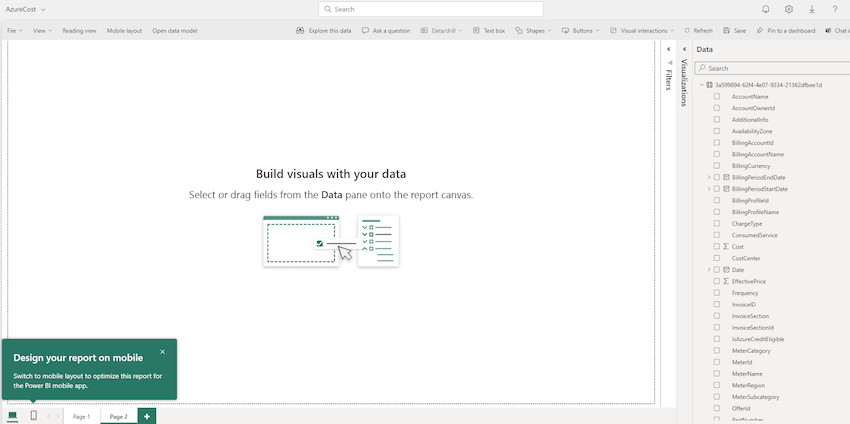
Next, import the CSV file into your Power BI environment. Once imported, you can view the data schema in the data pane.
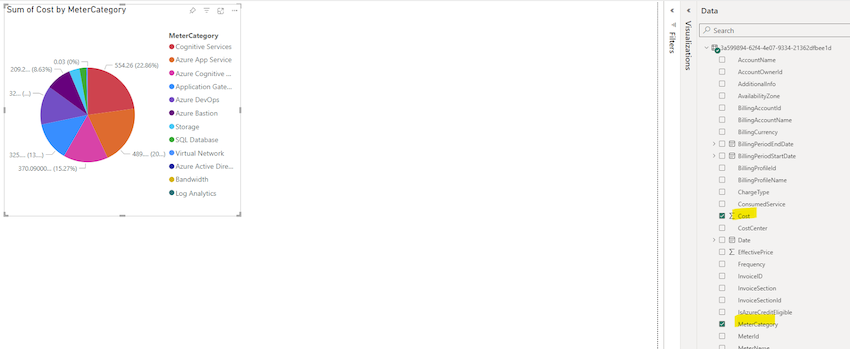
Let’s now start building our dashboard. First, let’s analyze the cost breakdown by each resource type. To do this, drag the ‘Cost‘ and ‘MeterCategory‘ columns onto the canvas and convert the visualization to a Pie Chart.
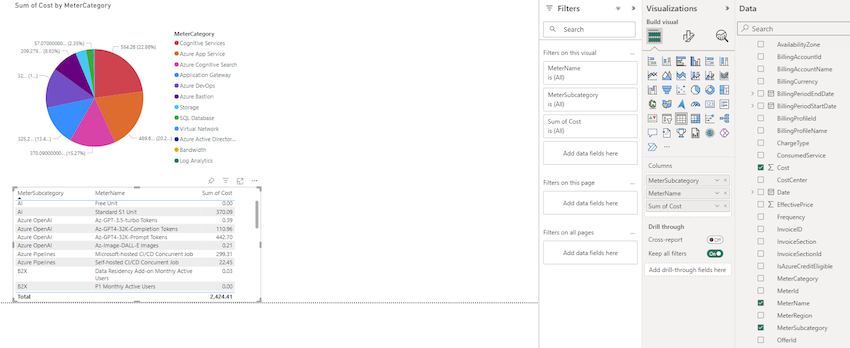
Then, move on to our second visualization. This will allow us to examine the cost of each service based on the plan or tier. Create a table showing ‘Cost‘, ‘MeterSubCategory‘, and ‘MeterName‘.
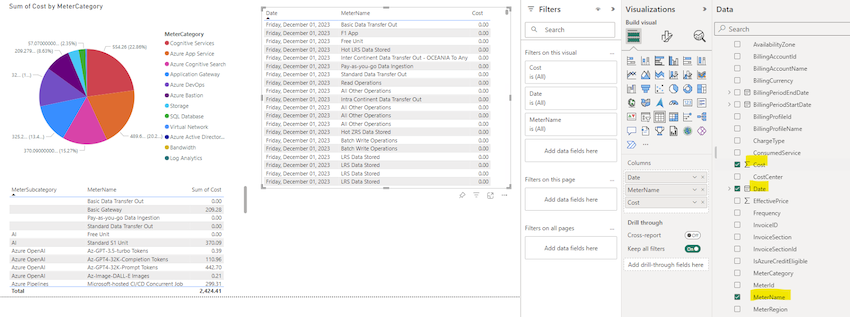
We’ve already gained valuable insights! But let’s dive deeper. We can analyze the daily costs for specific resources by adding another table displaying ‘Cost‘, ‘Date‘, and ‘MeterName‘ as shown below.
For our final visualization, let’s track the usage pattern for specific services over time. Create a line chart incorporating the ‘Cost‘, ‘Date‘, and ‘MeterName‘ fields.
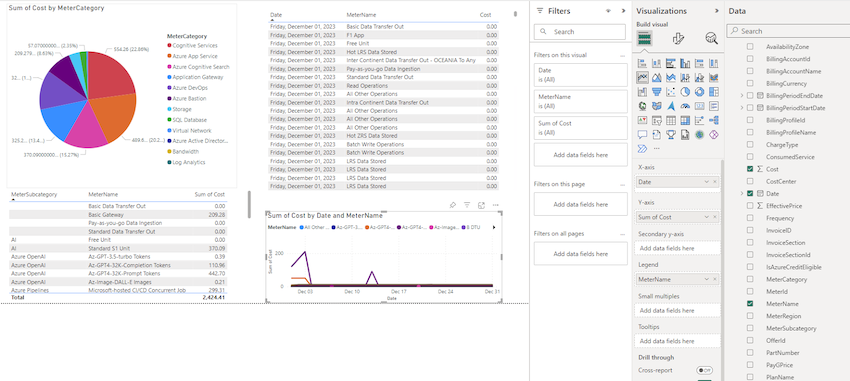
Finally, let’s improve the visual presentation by adding titles and applying formatting.
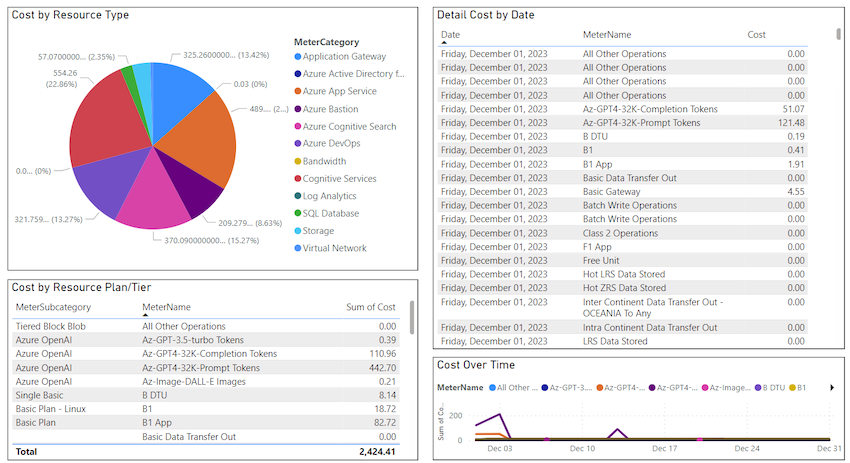
If you want to analyze a specific resource, like Cognitive Services, you can select that service from the first chart (Cost by Resource Type), and the other charts will adjust accordingly.
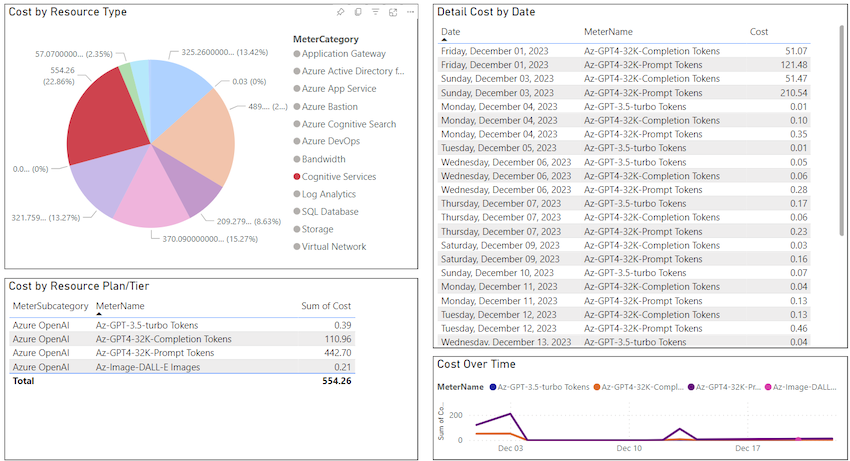
For instance, upon discovering higher expenses on GPT4 prompt tokens, you can drill down further by clicking on the relevant item in the second chart (Cost by Resource Plan/Tier).
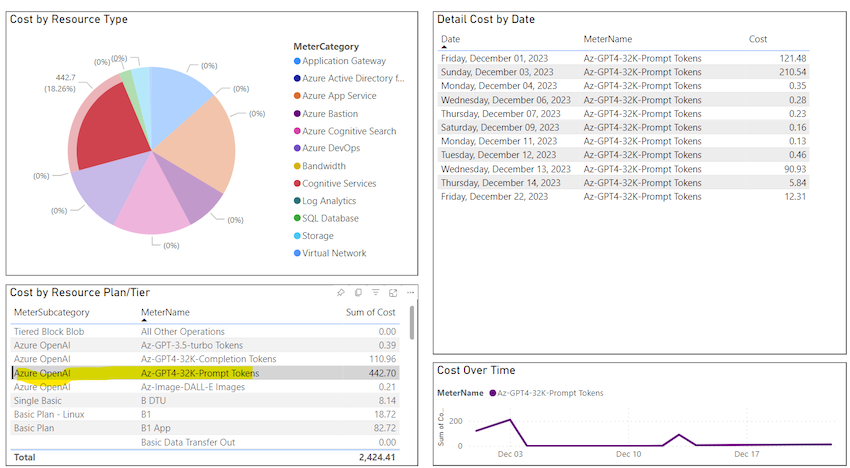
This method helps in identifying spending patterns and gaining insights into Azure costing mechanisms.
Explore our offerings at Skrots. Discover a wide range of services we provide at Skrots Services. Also, don’t forget to check out more insightful blogs on various topics at Blog at Skrots.

