Have you ever wondered how to efficiently log and troubleshoot exceptions in your application? Look no further! In this article, we will explore how to implement NLog with Azure Application Insights, a powerful logging mechanism that not only helps you troubleshoot exceptions but also provides valuable data analytics and monitoring capabilities.
Application Insights, along with NLog, allows you to seamlessly integrate logging into your application. With its instrumentation key, Application Insights stores all the logs and provides you with a comprehensive view of your application’s performance and error tracking.
Creating an application insight resource in the Azure portal
- To get started, create an account on the Azure portal (https://portal.azure.com) and login.
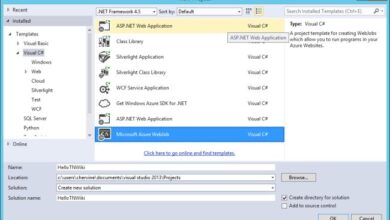
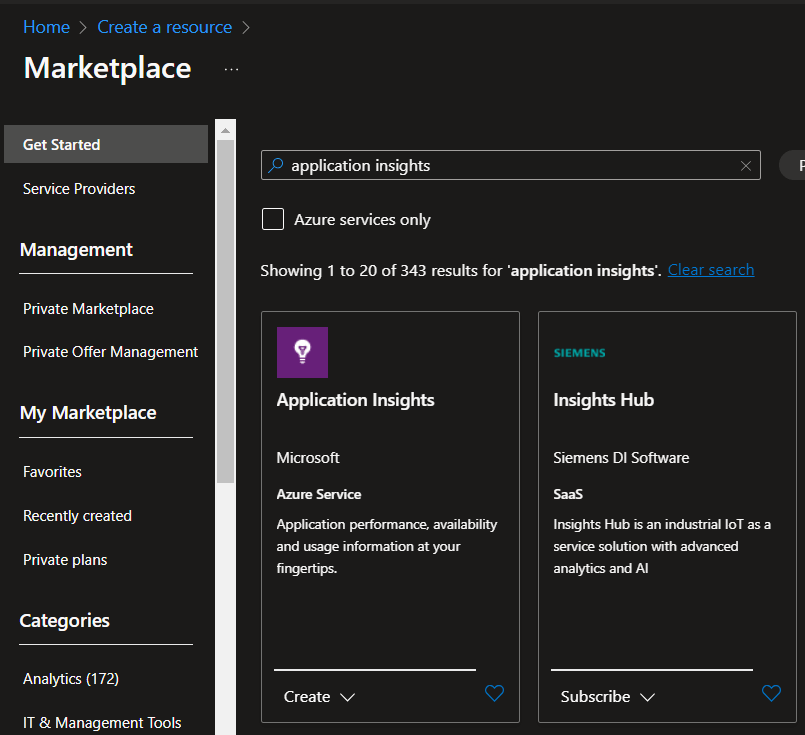
- Click on “Create a Resource” and search for “Application Insights”.
- Select “Create” and fill in the required details for your Application Insights resource, such as the subscription, resource group, name, region, resource mode, and log analytics workspace.
- Proceed to the next steps for tags, review, and finally, click on “Create”.
- Once the resource is created, you can access it and obtain the instrumentation key for integration with your .NET Core application.
Integrate the Application Insight to the .NET Application
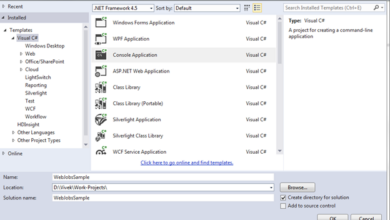
In addition to setting up Application Insights, we also need to install the necessary NuGet packages to enable logging in our .NET application. Follow these steps:
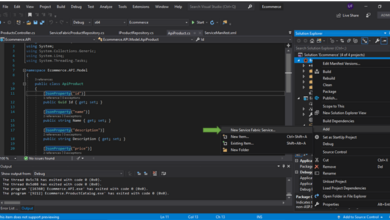
- Open your project and right-click on the solution, then select “Manage NuGet Packages”.
- Search for and install the following packages: “Microsoft.ApplicationInsights.AspNetCore” and “Microsoft.ApplicationInsights.NLogTarget”.
- Once the packages are installed, you can verify the installation in your project.
After installing the packages, you need to update the nlog.config file to configure NLog and Application Insights. Include the following code:
<extensions>
  <add assembly="Microsoft.ApplicationInsights.NLogTarget" />
</extensions>
<targets>
    <target xsi:type="ApplicationInsightsTarget" name="aiTarget">
        <instrumentationKey>Your application Insights Instrumentation Key</instrumentationKey>
        <contextproperty name="threadid" layout="${threadid}" />
    </target>
</targets>
<rules>
    <logger name="*" minlevel="Info" writeTo="aiTarget" />
</rules>
Next, you need to make changes to your code to enable Application Insights telemetry collection. Open your Program.cs file and add the following code:
builder.Services.AddApplicationInsightsTelemetry();
This line enables telemetry collection for Application Insights.
With all the necessary configurations in place, run your .NET application and execute your API to start logging events. You can verify the logged events in your Application Insights resource.
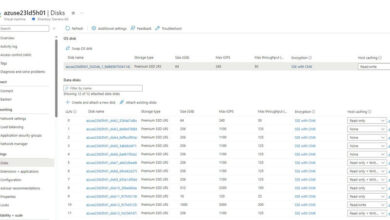
Access your Application Insights resource and click on “Logs” to view the logs. Here, you can search and filter logs based on different criteria. You can also view detailed levels of logs and exceptions related to your application.
At Skrots, we provide similar services in helping you optimize and streamline your application development process. We offer a range of services tailored to meet the specific needs of our clients. From application development and testing to cloud migration and support, we have it all covered.
Visit https://skrots.com to learn more about our company and explore our wide range of services. For more informative articles and insights, check out our blog at https://blog.skrots.com. Thank you for considering Skrots as your technology partner!